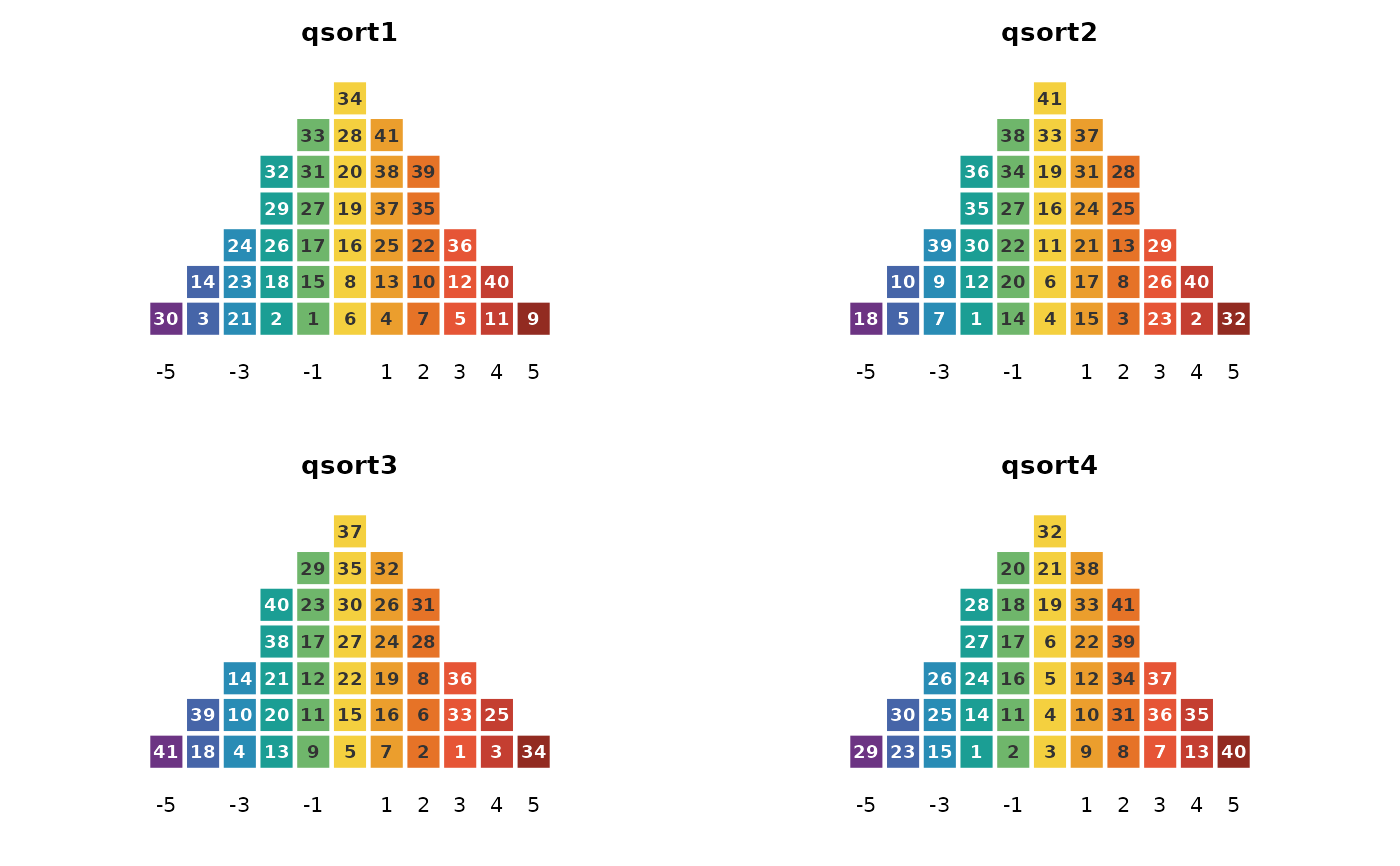
The grizzly bear reintroduction Q dataset from Easter et al. (2025): 67 participants each force-sorted 41 statements about reintroducing grizzly bears to the North Cascades onto an eleven-column grid (quotas 1-2-3-5-6-7-6-5-3-2-1, printed values -5 to +5). A real, published panel where the two-signal rule selects a two-factor solution, used in the package documentation.
Format
A qsort_data object: the 41 x 67 integer matrix of printed grid values with statement and participant ids, and the forced distribution.
Source
Easter, T. S., Santo, A. R., Sage, A. H., Carter, N. H., Chan, K. M. A., & Ransom, J. I. (2025). Divergent values and perspectives drive three distinct viewpoints on grizzly bear reintroduction in Washington, the United States. People and Nature, 7, 127–145. doi:10.1002/pan3.10748 . Data from the Dryad repository under CC0, doi:10.5061/dryad.73n5tb369 .
Examples
grizzly_sorts
#> Q-sort data
#>   statements  : 41   participants : 67
#>   distribution: 1 2 3 5 6 7 6 5 3 2 1   (sum = 41 )
#>   value range : [-5, 5]
#>   source      : excel:Grizzly bear dataset.xlsx
plot(grizzly_sorts, participants = 1:4)