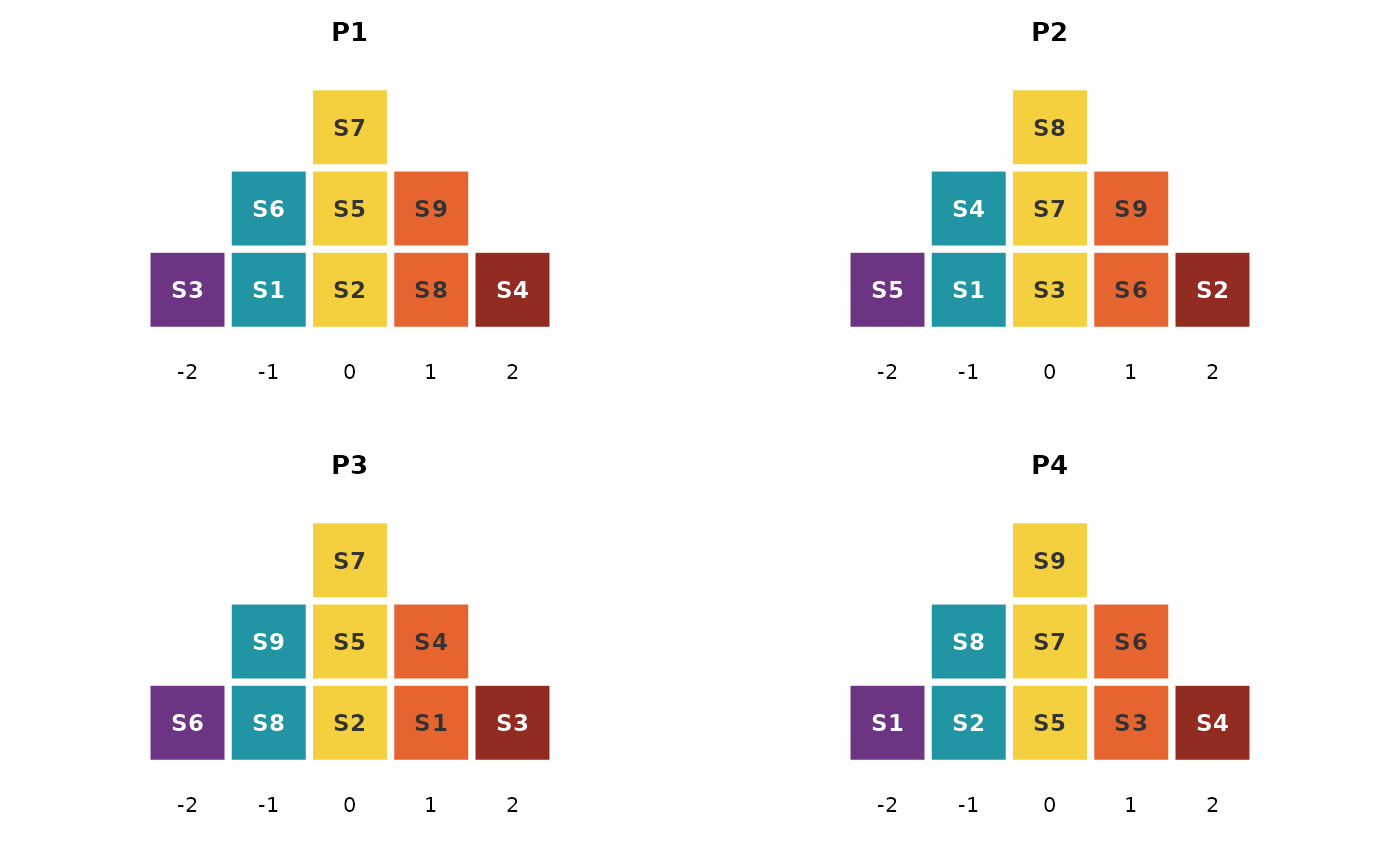
Draws each participant's completed sort as their own pyramid: one tile
per statement, stacked in its grid column, colored along the
disagree-agree axis. This is the look-at-the-decisions-first view:
run it straight after import, before any analysis, to see how every
participant grouped the statements. plot(qdata) does the same.
Arguments
- x
A
qsort_dataobject or aJ x Nmatrix of sorts.- participants
Which participants to draw (names or indices);
NULL(default) draws everyone.- per_page
How many pyramids per page (default up to 12, arranged automatically); further participants continue on the next page.
- labels
Optional statement labels for the tiles (defaults to the statement ids).
- cex
Tile label size;
NULL(default) adapts to the tallest column.