Every plot in the package reads its palette through
bayesqm_colors(). Call bayesqm_set_colors() to switch the active
scheme for every subsequent plot. The available built-in schemes
are "blue" (default), "teal", "red", "purple", and "grey".
For full control, pass a named list with slots light, mid,
dark, accent, grey, gridgrey, and fill.
Value
bayesqm_colors() returns the active palette as a named
list. bayesqm_set_colors() returns the previous scheme name,
invisibly.
Examples
bayesqm_colors()
#> $light
#> [1] "#d1e1ec"
#>
#> $mid
#> [1] "#6497b1"
#>
#> $dark
#> [1] "#03306b"
#>
#> $accent
#> [1] "#8F272C"
#>
#> $grey
#> [1] "grey40"
#>
#> $gridgrey
#> [1] "grey75"
#>
#> $fill
#> [1] "#b3cde0"
#>
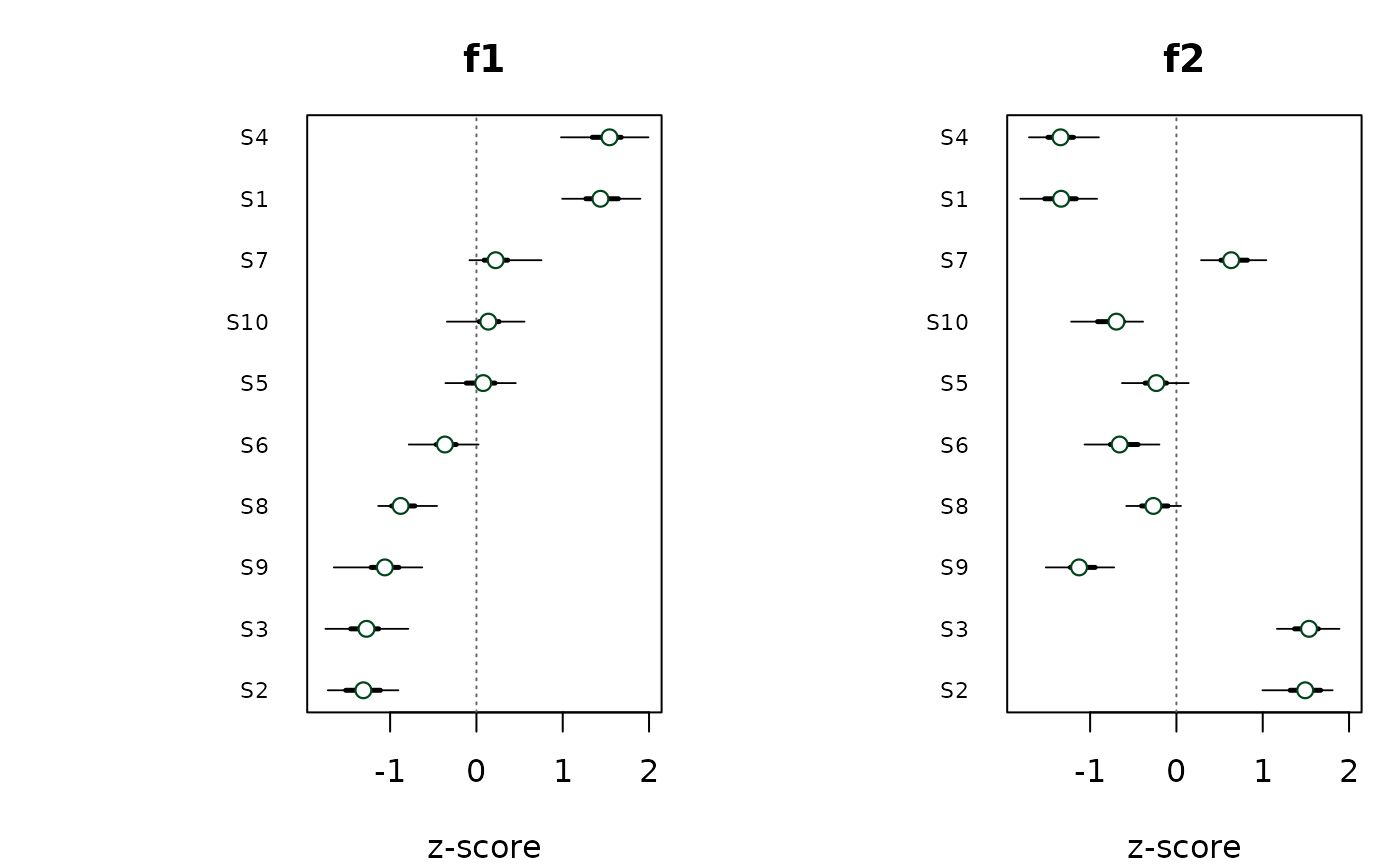
fit <- demo_fit(N = 6, J = 10, K = 2, Td = 50, seed = 1)
bayesqm_set_colors("teal")
plot(fit)
 bayesqm_set_colors("blue") # restore default