
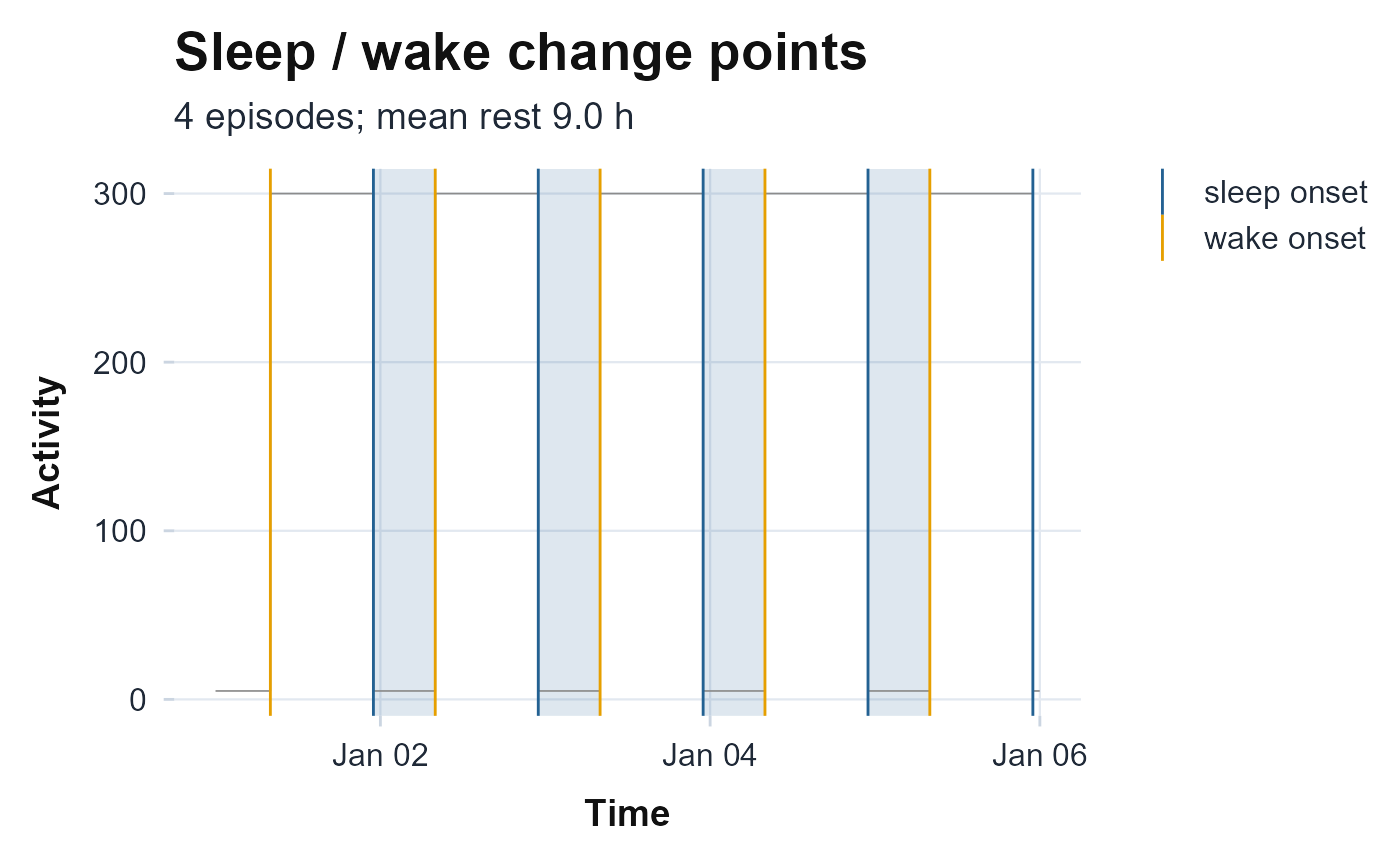
Plots the activity series with the per-night sleep-onset and wake-onset change
points from sleep.changepoints marked and the detected sleep
episodes shaded, so each night's rest timing is visible against the raw counts.
Returns a ggplot object and never errors.
Arguments
- counts
Numeric activity vector (minute epochs recommended).
- timestamps
POSIXct timestamps, one per value.
- ...
Passed to
sleep.changepoints(e.g.thr).
References
Chen S, Sun X (2024). “Validating CircaCP: a generic sleep-wake cycle detection algorithm for unlabelled actigraphy data.” Royal Society Open Science, 11(5), 231468. doi:10.1098/rsos.231468 .
Examples
# \donttest{
ts <- seq(as.POSIXct("2024-01-01", tz = "UTC"), by = 60, length.out = 5 * 1440)
h <- as.numeric(format(ts, "%H"))
plot_changepoints(ifelse(h >= 8 & h < 23, 300, 5), ts)
 # }
# }