Cosinor Amplitude-Acrophase Confidence Ellipse
Source:R/circadian_cosinor_plots.R
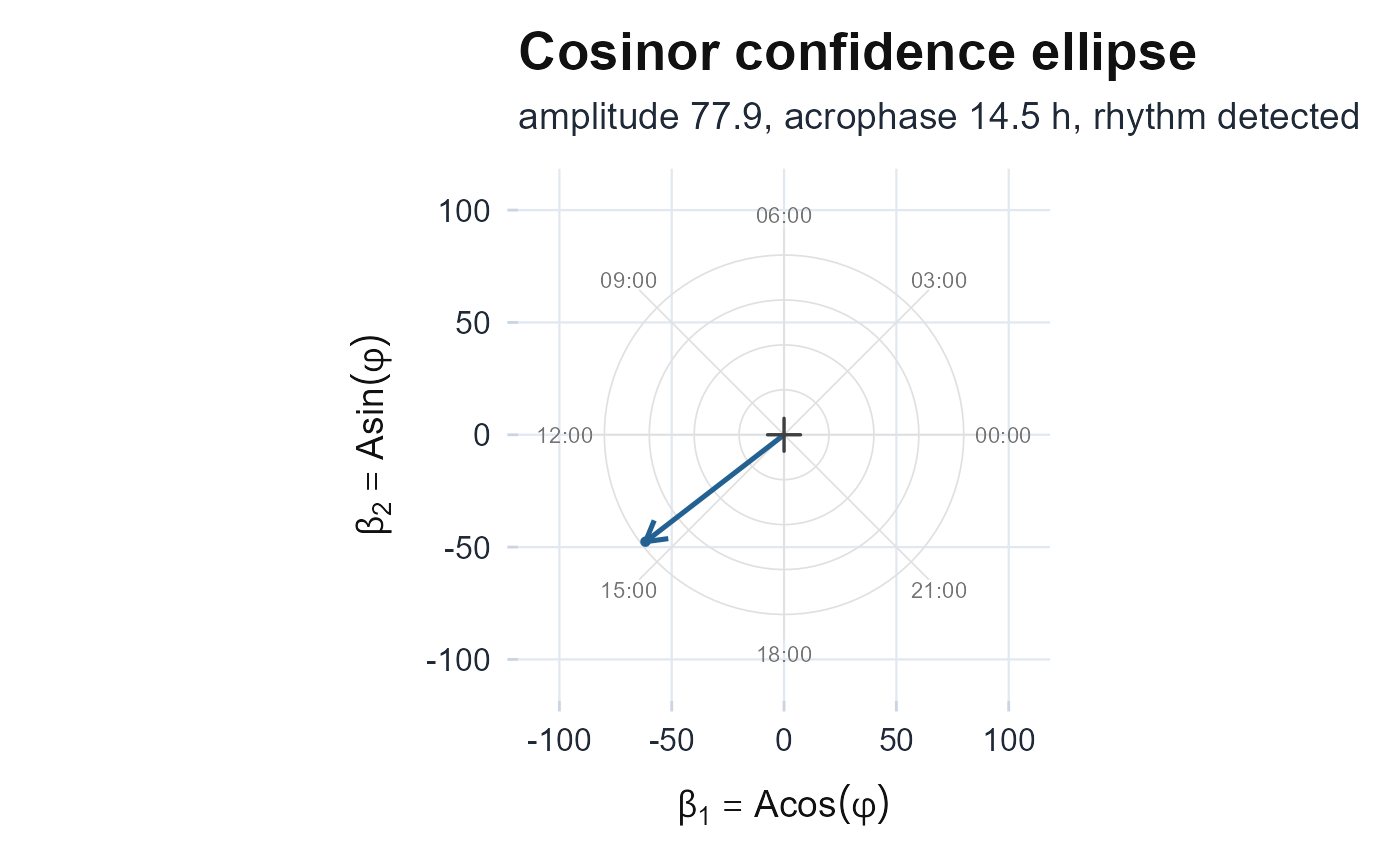
plot_cosinor_ellipse.RdDraws the joint confidence ellipse of the cosinor cosine and sine coefficients
on the amplitude-acrophase plane, over clock-hour spokes and amplitude rings.
The estimate is the vector from the pole, and the rhythm is detectable when the
ellipse excludes the pole (Bingham et al. 1982). Returns a ggplot object
and never errors.
References
Bingham C, Arbogast B, Cornelissen Guillaume G, Lee JK, Halberg F (1982). “Inferential statistical methods for estimating and comparing cosinor parameters.” Chronobiologia, 9(4), 397–439.
Examples
set.seed(1)
ts <- seq(as.POSIXct("2024-01-01", tz = "UTC"), by = 60, length.out = 3 * 1440)
h  <- as.numeric(format(ts, "%H"))
counts <- pmax(0, 100 + 80 * cos(2 * pi * (h - 14) / 24) + rnorm(length(h), 0, 25))
plot_cosinor_ellipse(counts, ts)