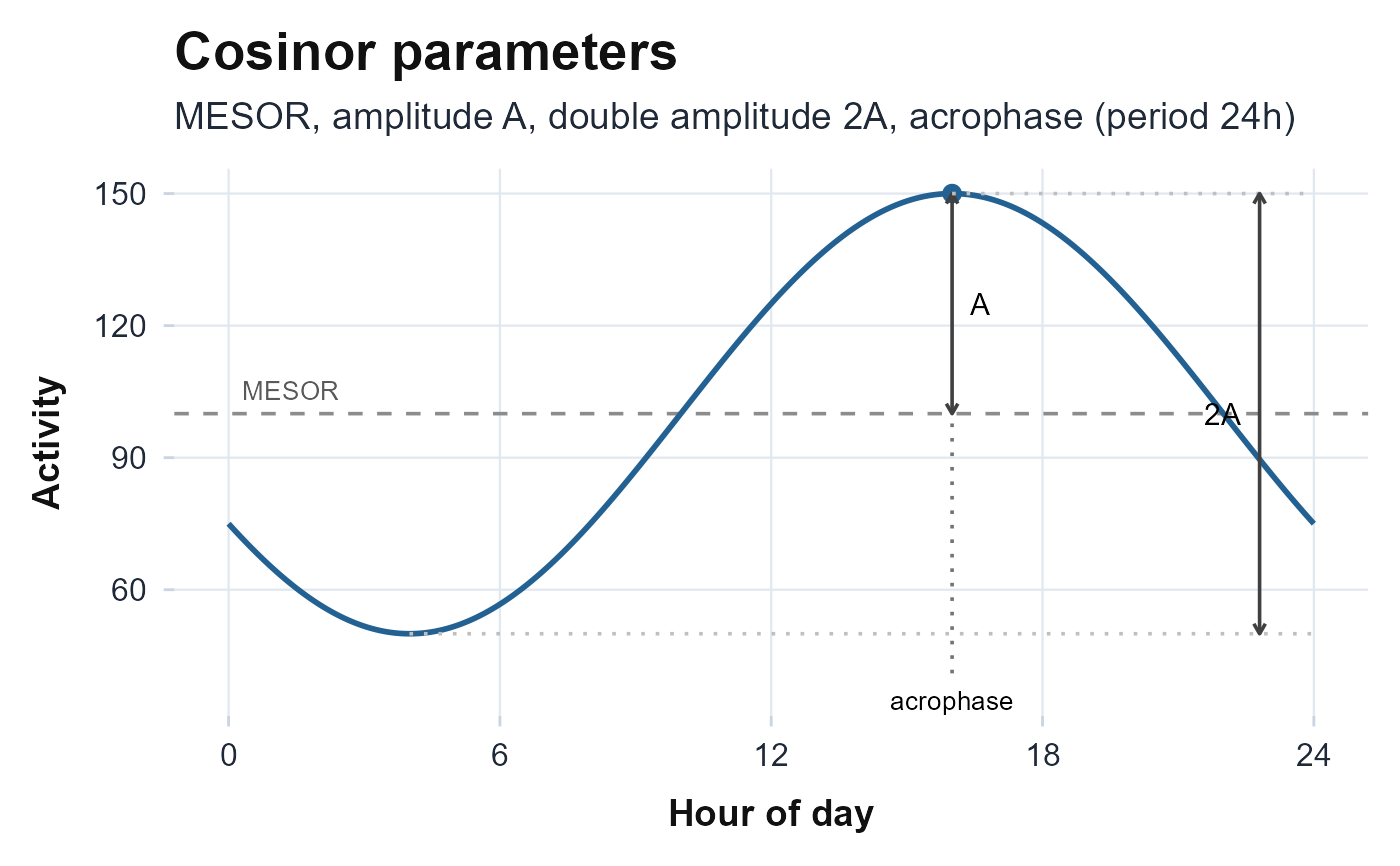
A teaching figure: one smooth cosine annotating the MESOR (midline), the
amplitude A and double amplitude 2A, the acrophase (clock time of the peak),
and the period. Useful as a legend for the cosinor parameters. Returns a
ggplot object and never errors.
Usage
plot_cosinor_schematic(
  mesor = 100,
  amplitude = 50,
  acrophase = 16,
  period = 24
)
Arguments
- mesor, amplitude
Midline and amplitude of the illustrated cosine.
- acrophase
Clock time of the peak, in hours.
- period
Period in hours (default 24).
Examples
plot_cosinor_schematic()