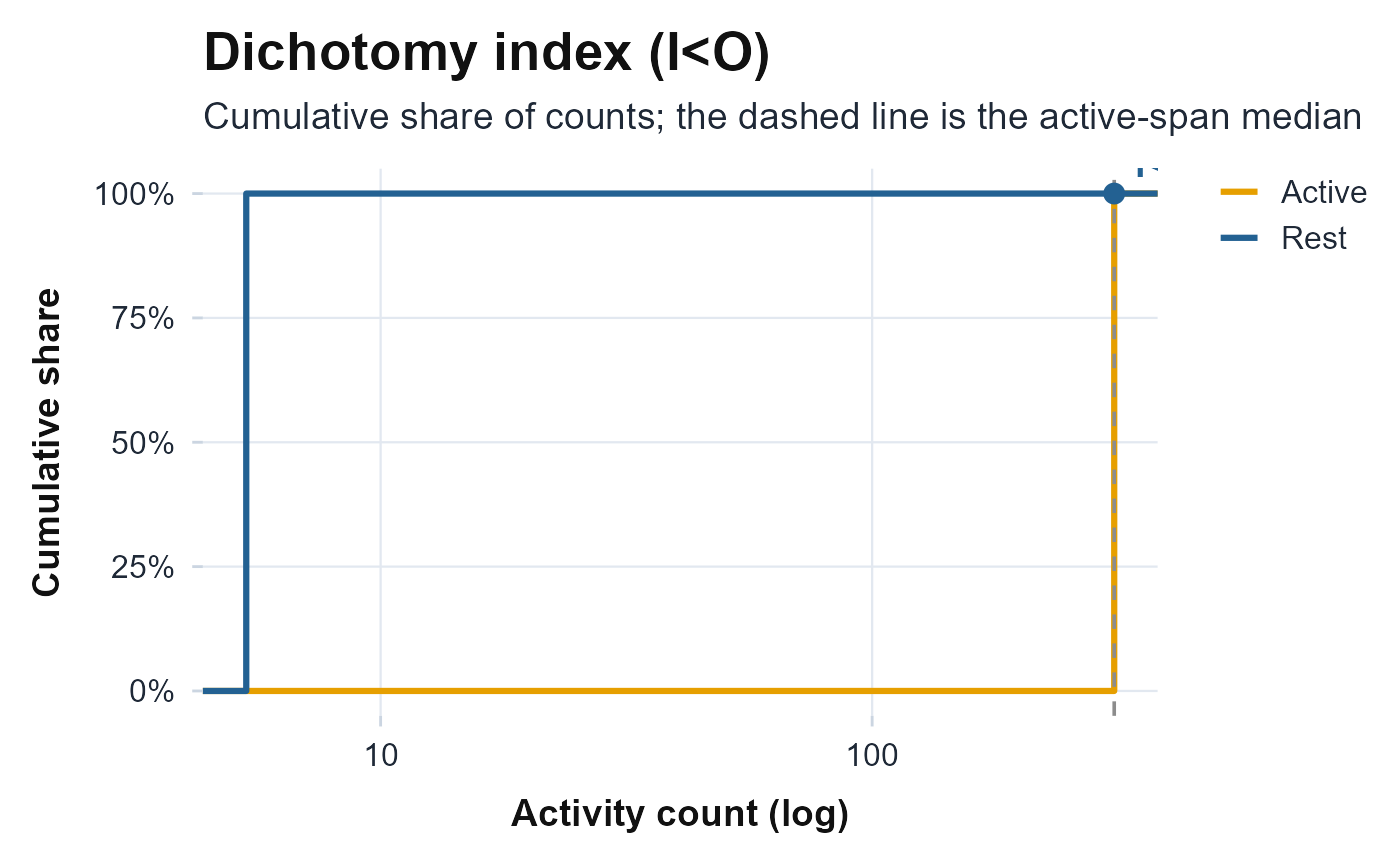
Cumulative distributions of the rest-span and active-span activity counts on a
log scale, marking the active-span median and the dichotomy index I<O (the
share of rest-span counts below that median). Returns a ggplot object
and never errors.
Arguments
- counts
Numeric activity vector.
- rest
Logical (TRUE = rest), or a character state vector as accepted by
dichotomy.index. Same length ascounts.
References
Mormont MC, Waterhouse J, Bleuzen P, Giacchetti S, Jami A, Bogdan A, Lellouch J, Misset JL, Touitou Y, Levi F (2000). “Marked 24-h rest/activity rhythms are associated with better quality of life, better response, and longer survival in patients with metastatic colorectal cancer and good performance status.” Clinical Cancer Research, 6(8), 3038–3045.
Examples
ts <- seq(as.POSIXct("2024-01-01", tz = "UTC"), by = 60, length.out = 2 * 1440)
h  <- as.numeric(format(ts, "%H"))
plot_dichotomy(ifelse(h >= 23 | h < 7, 5, 300), rest = h >= 23 | h < 7)