
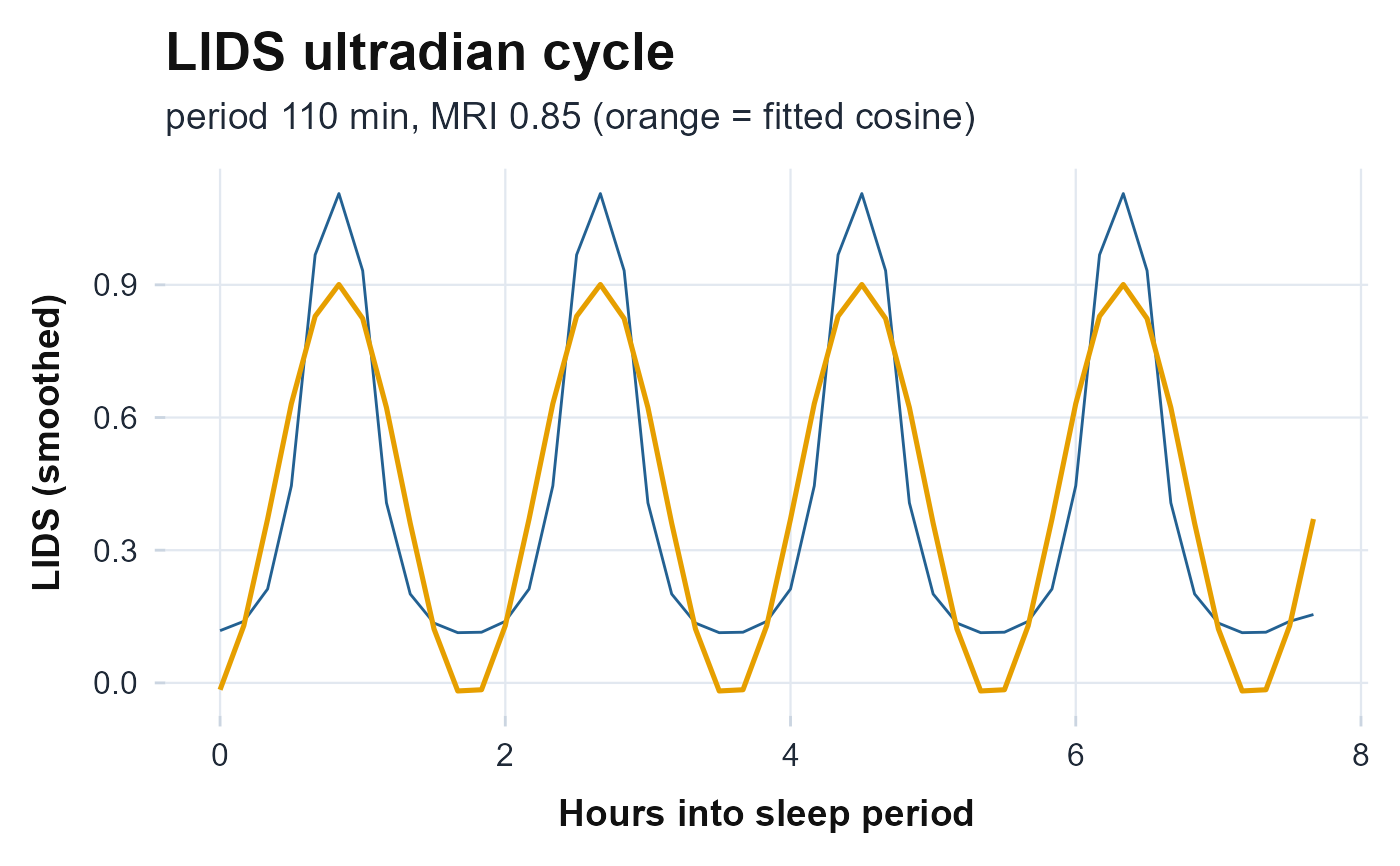
Plots the smoothed Locomotor Inactivity During Sleep (LIDS) signal across one
sleep period with the best-fit ultradian cosine overlaid, the companion figure
to lids. The cosine's period and Munich Rhythmicity Index
summarise the sleep-cycle oscillation. Returns a ggplot object and never
errors.
References
Winnebeck EC, Fischer D, Leise T, Roenneberg T (2018). “Dynamics and ultradian structure of human sleep in real life.” Current Biology, 28(1), 49–59. doi:10.1016/j.cub.2017.11.063 .
Examples
# \donttest{
ts <- seq(as.POSIXct("2024-01-01 22:00", tz = "UTC"), by = 60, length.out = 480)
sp <- data.frame(in_bed_time = ts[1], out_bed_time = ts[480])
plot_lids(50 + 45 * cos(2 * pi * seq_along(ts) / 110), ts, sp)
 # }
# }