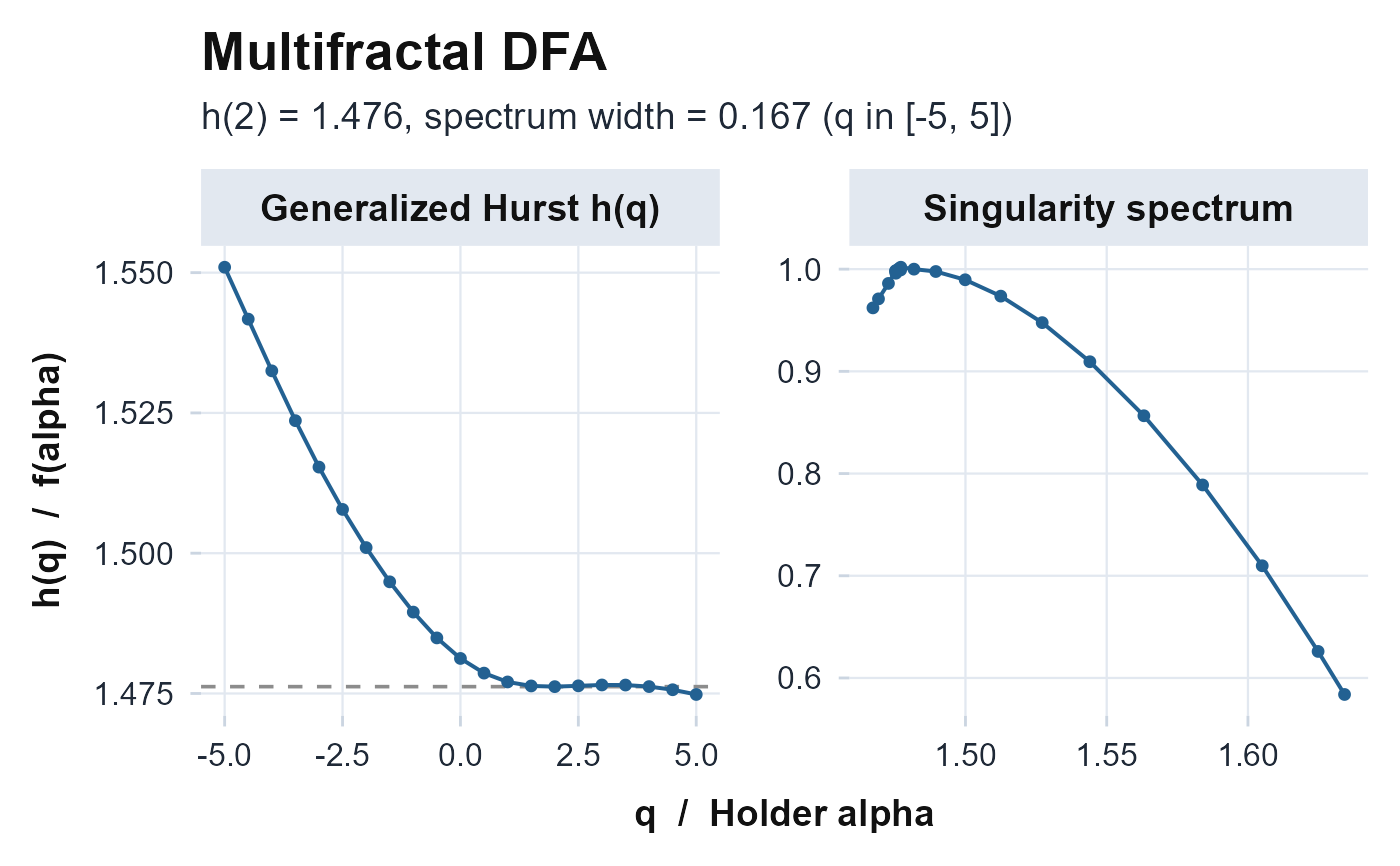
Two panels from mfdfa: the generalized Hurst exponent h(q) against
q (flat = monofractal, decreasing = multifractal, with h(2) marked) and the
singularity spectrum f(alpha) (the arch whose width measures multifractality).
Returns a ggplot object and never errors.
Usage
plot_mfdfa(counts, q_values = seq(-5, 5, by = 0.5), detrend_order = 1L)References
Kantelhardt JW, Zschiegner SA, Koscielny-Bunde E, Havlin S, Bunde A, Stanley HE (2002). “Multifractal detrended fluctuation analysis of nonstationary time series.” Physica A: Statistical Mechanics and its Applications, 316(1-4), 87–114. doi:10.1016/S0378-4371(02)01383-3 .