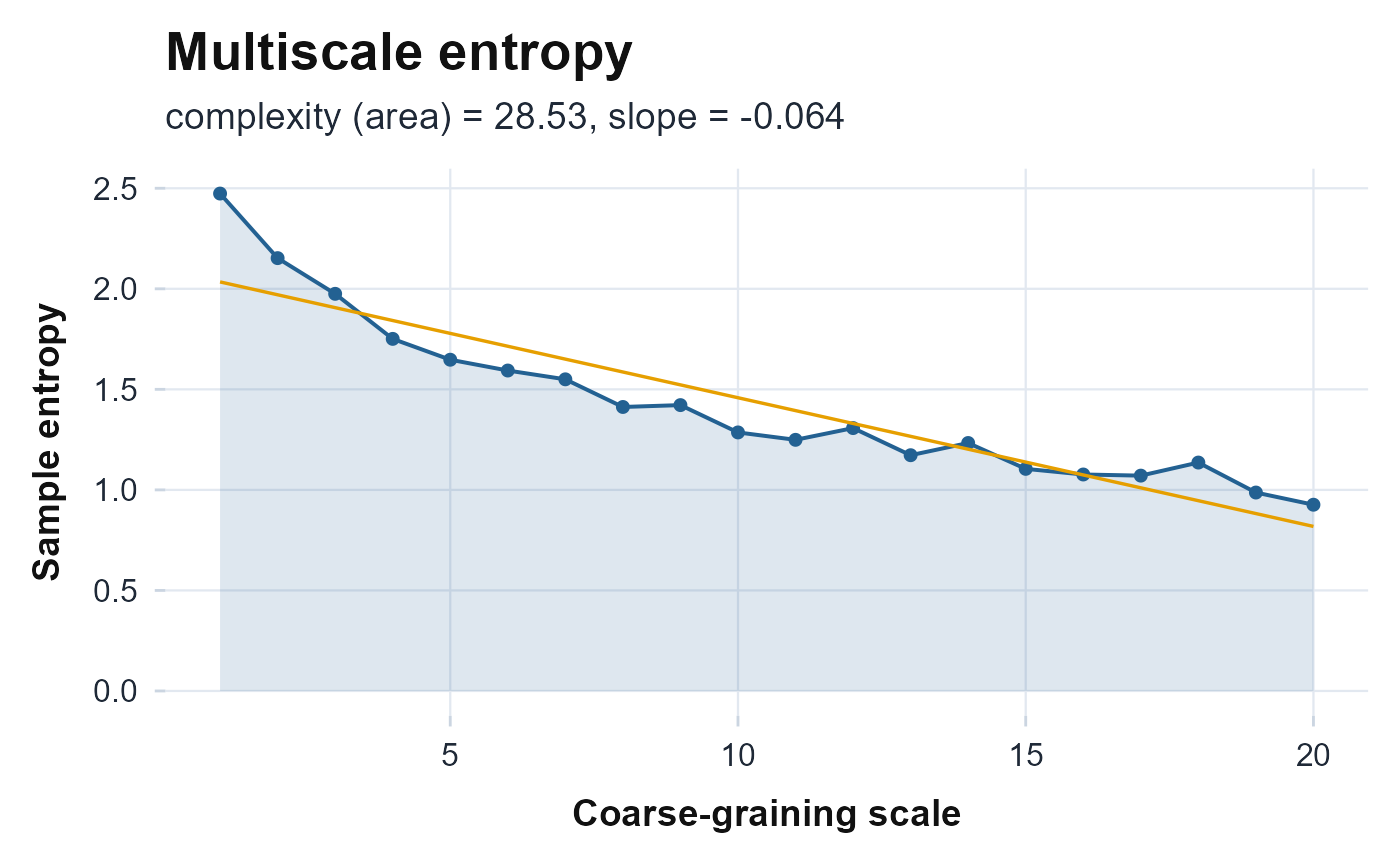
Sample entropy from multiscale.entropy against the coarse-graining
scale, with the complexity index (area) shaded and the across-scale slope drawn.
A curve that holds its entropy across scales marks a complex signal; one that
falls is closer to noise. Returns a ggplot object and never errors.
References
Costa M, Goldberger AL, Peng C (2002). “Multiscale entropy analysis of complex physiologic time series.” Physical Review Letters, 89(6), 068102. doi:10.1103/PhysRevLett.89.068102 .