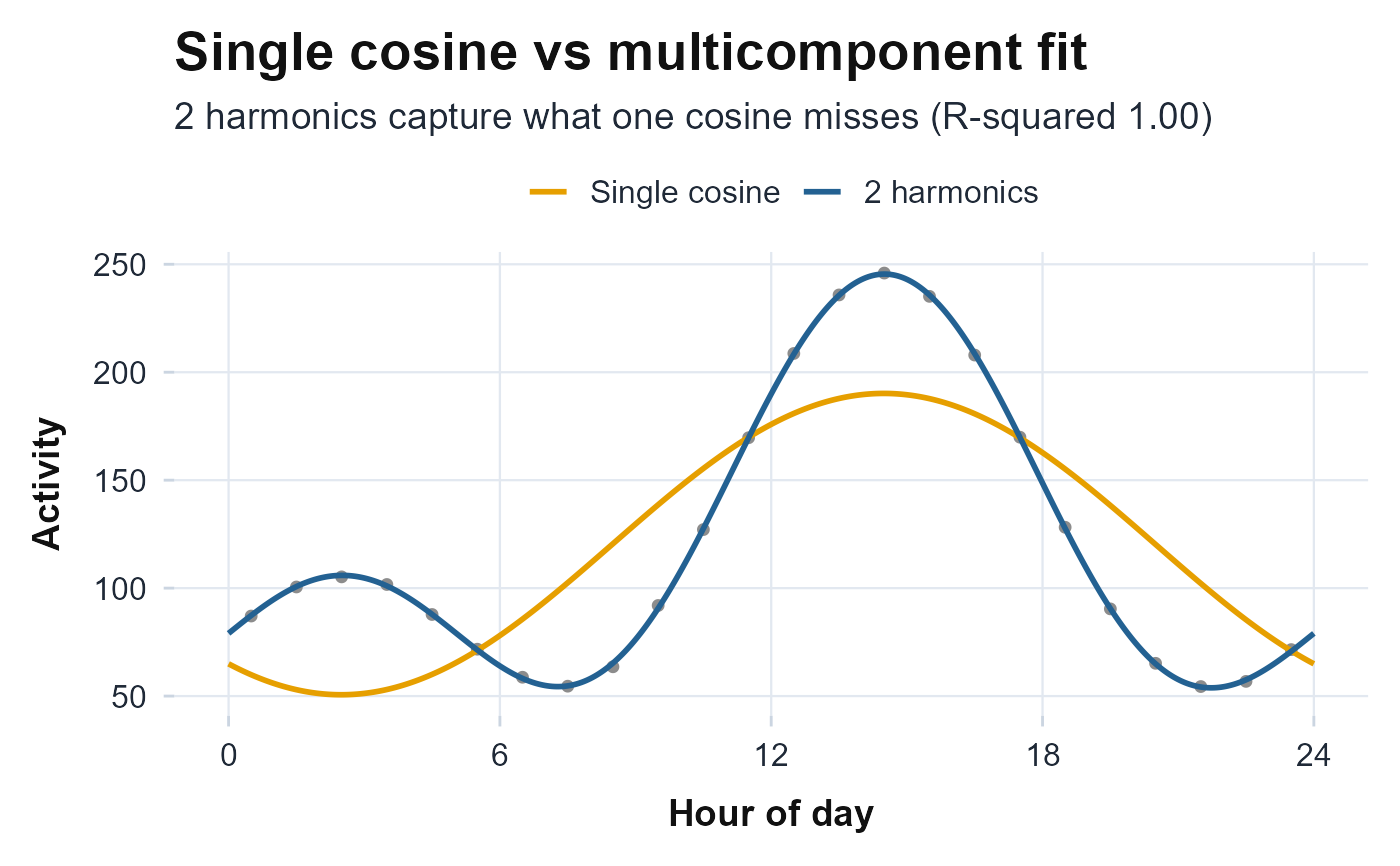
Single Cosine vs Multicomponent Cosinor Fit
Source:R/circadian_cosinor_plots.R
plot_multicomponent.RdOverlays the averaged daily profile with the single 24-hour cosine and the
selected multi-harmonic cosinor (Cornelissen 2014), showing the structure a
single symmetric cosine cannot follow. The number of harmonics and the fit are
taken from cosinor.multicomponent; the curves are refit on the
hour-of-day profile so they align with the plotted points. Returns a
ggplot object and never errors.
References
Cornelissen G (2014). “Cosinor-based rhythmometry.” Theoretical Biology and Medical Modelling, 11, 16. doi:10.1186/1742-4682-11-16 .
Examples
set.seed(2)
ts <- seq(as.POSIXct("2024-01-01", tz = "UTC"), by = 60, length.out = 4 * 1440)
h  <- as.numeric(format(ts, "%H"))
siesta <- pmax(0, 120 + 70 * cos(2 * pi * (h - 14) / 24) +
  55 * cos(2 * pi * 2 * (h - 14) / 24) + rnorm(length(ts), 0, 12))
plot_multicomponent(siesta, ts)