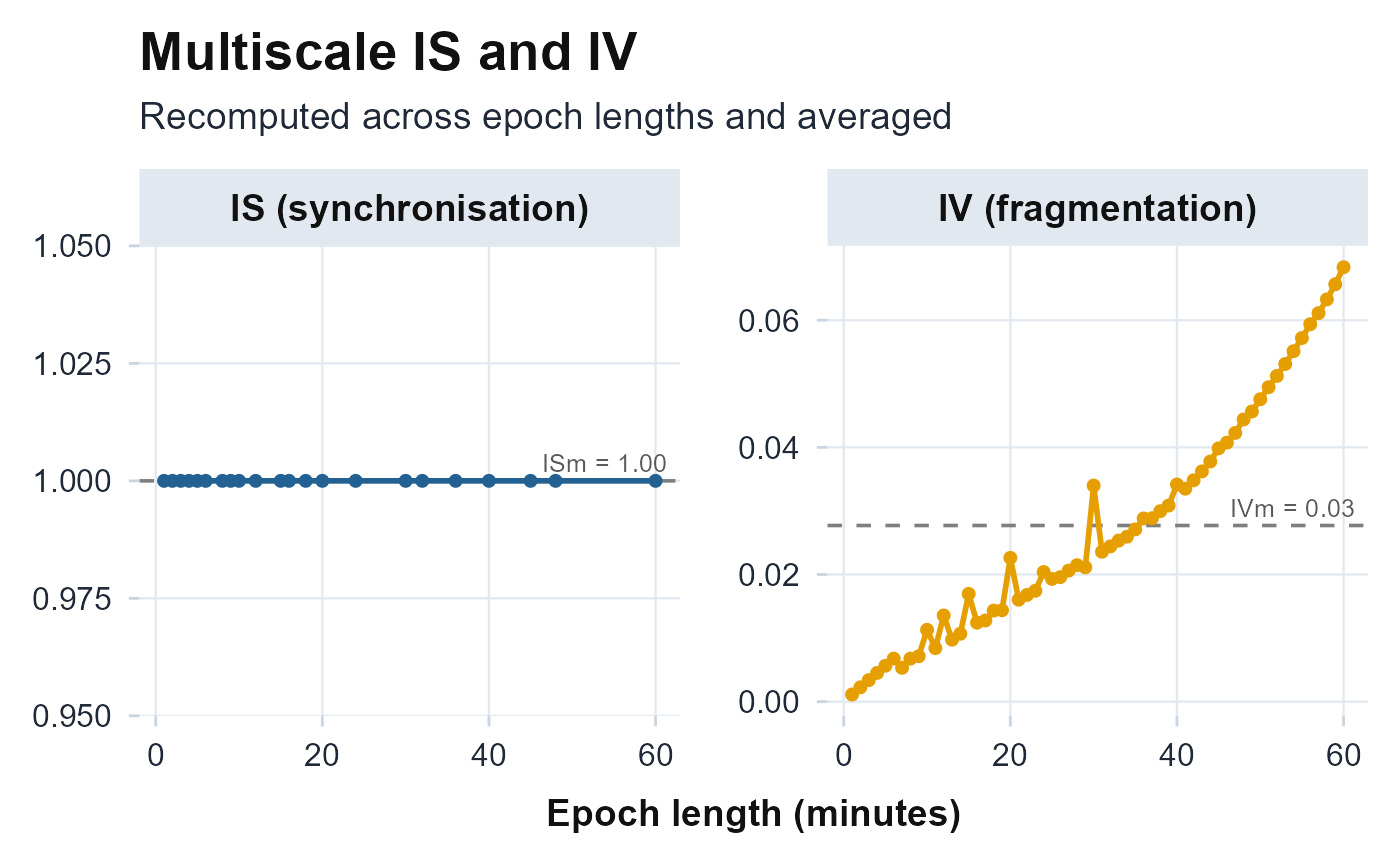
Interdaily stability and intradaily variability recomputed across epoch
lengths, with the averaged ISm and IVm marked. Returns a ggplot object
and never errors.
References
Goncalves BSB, Cavalcanti PRA, Tavares GR, Campos TF, Araujo JF (2014). “Nonparametric methods in actigraphy: an update.” Sleep Science, 7(3), 158–164. doi:10.1016/j.slsci.2014.09.013 .
Examples
ts <- seq(as.POSIXct("2024-01-01", tz = "UTC"), by = 60, length.out = 4 * 1440)
h  <- as.numeric(format(ts, "%H"))
plot_multiscale(pmax(0, 100 + 80 * cos(2 * pi * (h - 14) / 24)), ts)