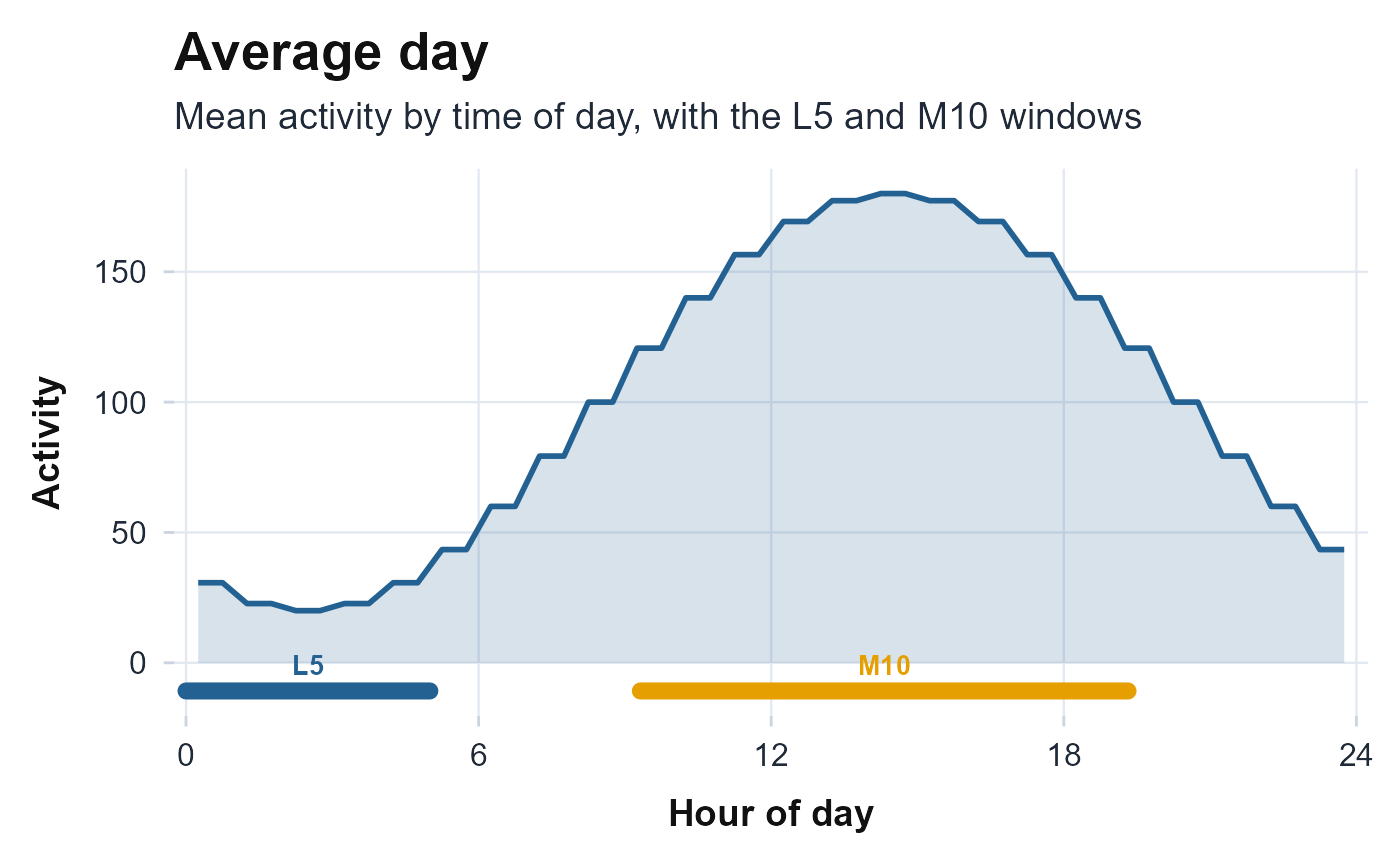
Average-Day Profile with the L5 and M10 Windows
Source:R/circadian_nonparametric_plots.R
plot_profile.RdThe averaged daily activity profile (mean across days with a one-standard-
deviation band), with the least-active 5-hour window L5 and the most-active
10-hour window M10 marked on a window track beneath the curve. Returns a
ggplot object and never errors.
References
Van Someren EJW, Swaab DF, Colenda CC, Cohen W, McCall WV, Rosenquist PB (1999). “Bright light therapy: improved sensitivity to its effects on rest-activity rhythms in Alzheimer patients by application of nonparametric methods.” Chronobiology International, 16(4), 505–518. doi:10.3109/07420529908998724 .
Examples
ts <- seq(as.POSIXct("2024-01-01", tz = "UTC"), by = 60, length.out = 7 * 1440)
h  <- as.numeric(format(ts, "%H"))
plot_profile(pmax(0, 100 + 80 * cos(2 * pi * (h - 14) / 24)), ts)