
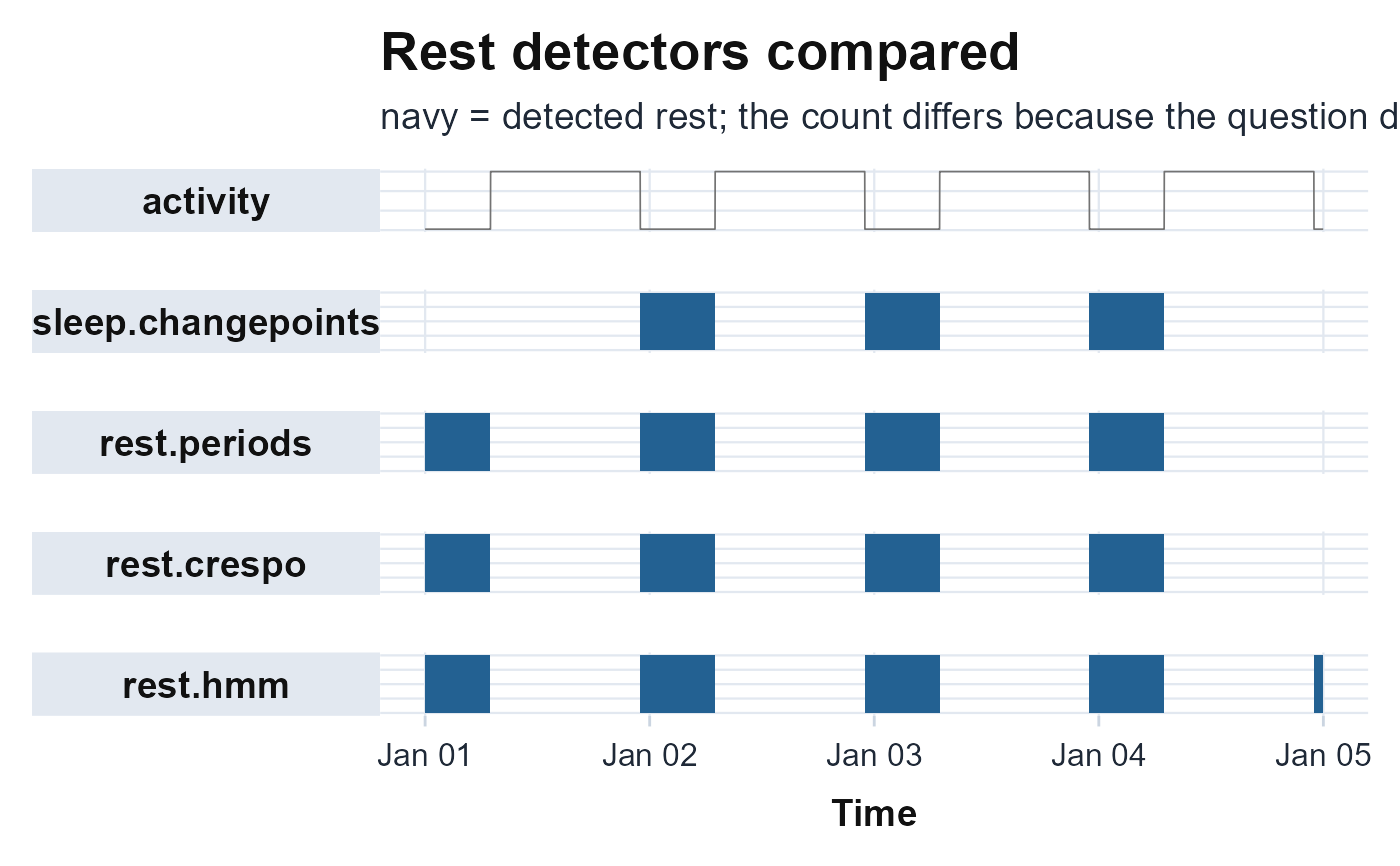
Runs the four rest/sleep detectors on one recording and stacks their detected
rest bands over the activity series on a shared time axis, so the user can see
that the differing bout counts reflect different questions (main night vs every
bout vs latent state), not contradictory accuracy. Returns a ggplot
object and never errors.
Examples
# \donttest{
ts <- seq(as.POSIXct("2024-01-01", tz = "UTC"), by = 60, length.out = 4 * 1440)
h <- as.numeric(format(ts, "%H"))
plot_rest_comparison(ifelse(h >= 23 | h < 7, 5, 300), ts)
 # }
# }