
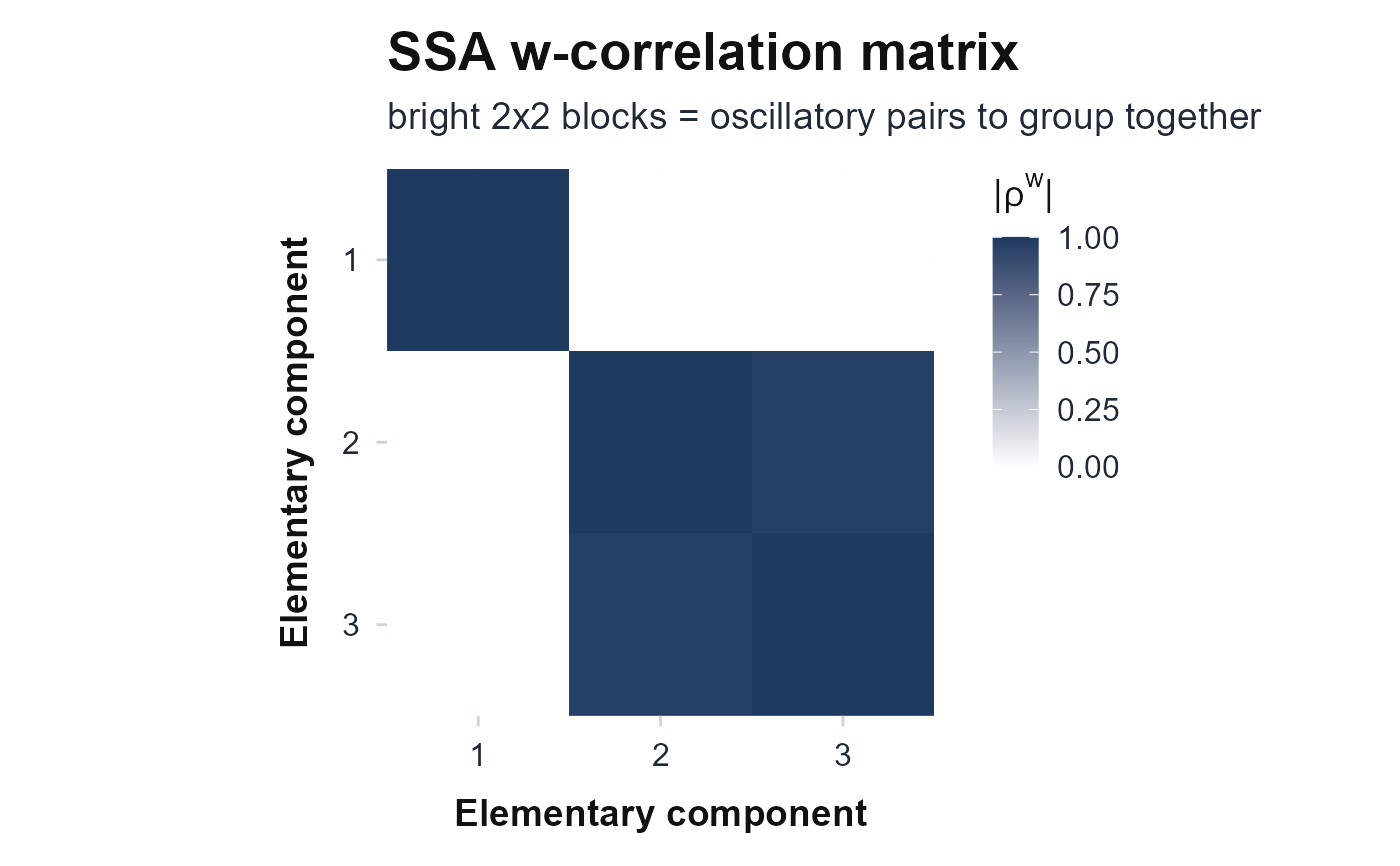
Plots the weighted-correlation matrix of the leading SSA elementary components
from circadian.ssa. Bright off-diagonal 2x2 blocks are oscillatory
pairs (the grouping aid of Golyandina 2013); a single bright cell is the trend
and a diffuse block is noise. Returns a ggplot object and never errors.
References
Golyandina N, Zhigljavsky A (2013). Singular Spectrum Analysis for Time Series, SpringerBriefs in Statistics. Springer. doi:10.1007/978-3-642-34913-3 .
Examples
# \donttest{
ts <- seq(as.POSIXct("2024-01-01", tz = "UTC"), by = 600, length.out = 8 * 144)
th <- as.numeric(difftime(ts, ts[1], units = "hours"))
plot_ssa_wcor(100 + 60 * cos(2 * pi * th / 24), ts)
 # }
# }